Metrics#
Tunix provides a comprehensive observability stack for training LLMs, encompassing everything from basic training metrics to detailed execution traces. This section is composed of three main pillars:
Collected Metrics: Describes a rich set of system, model, and RL-specific performance metrics out of the box.
Metric Loggers: Describes a flexible, protocol-based logging system that allows you to seamlessly integrate with your preferred logging service (e.g., TensorBoard, Wandb, CLU) or create custom backends.
Performance Metric Tracing: Describes a built-in, lightweight tracing system that generates detailed execution timelines for deep performance analysis and visualization in Perfetto.
Collected Metrics#
Tunix automatically collects a rich set of metrics during training to help you monitor performance, convergence, and resource utilization.
Common Metrics (SFT & RL)#
These metrics are collected for both Supervised Fine-Tuning (SFT) and Reinforcement Learning (RL) jobs:
loss: The training loss for the current step.perplexity: The perplexity of the model on the training batch (exp(loss)).learning_rate: The current learning rate from the optimizer.step_time_sec: The time taken to execute a single training step (in seconds).steps_per_sec: The training speed, measured in steps per second.tflops_per_step: The estimated Trillion Floating Point Operations (TFLOPs) performed per step (if supported by the hardware/backend).
RL-Specific Metrics (PPO/GRPO)#
For Reinforcement Learning jobs, Tunix collects additional metrics related to the RL algorithm (e.g., PPO), reward modeling, and generation.
Rewards & Scores#
rewards/sum: The sum of rewards for a trajectory.rewards/mean,rewards/max,rewards/min: Statistics of the rewards across the batch.score/mean,score/max,score/min: Statistics of the raw scores from the reward model (before any algorithm-specific modifications like KL penalty).reward_kl_penalty: The KL divergence penalty applied to the reward (if applicable).rewards/<reward_fn_name>: If using multiple reward functions, individual reward components are logged by name.
Policy & Value (PPO)#
advantages/mean,advantages/max,advantages/min: Statistics of the advantages.returns/mean,returns/max,returns/min: Statistics of the returns.values/mean,values/max,values/min: Statistics of the value function estimates.pg_clipfrac: The fraction of the batch where the policy gradient was clipped.vf_clipfrac: The fraction of the batch where the value function update was clipped.loss/entropy: The entropy of the policy (if entropy regularization is enabled).
Generation & Data#
prompts: The input prompts used for generation.completions: The text completions generated by the model.completions/mean_length,completions/max_length,completions/min_length: Statistics on the length of generated completions.trajectory_ids: Unique identifiers for the trajectories.actor_dequeue_time: Time spent waiting for data from the rollout workers (if async rollout is enabled).
Metric Loggers#
Tunix provides a flexible, protocol-based logging system that allows you to integrate any logging service or library.
The primary interface for logging is the MetricsLogger. It is configured
using MetricsLoggerOptions. Below is an example of how to configure the
MetricsLogger. Note: The exact fields that need to be configured depend
on the backend, which typically defaults based on the execution environment. See
Logging Backends Supported for details on
backend-specific configurations.
from tunix.sft import metrics_logger

options = metrics_logger.MetricsLoggerOptions(
    log_dir="/tmp/logs",
    project_name="my-project",
    run_name="experiment-1",
)
logger = metrics_logger.MetricsLogger(metrics_logger_options=options)
With the above, agentic_grpo_learner will by default start an async trajectory
logger which logs the trajectories including prompts, responses, etc. to the
specified log_dir.
Enabling Metrics in Jobs#
Once you have your MetricsLoggerOptions configured, you can pass it to your
SFT or RL job via the training configuration.
Supervised Fine-Tuning (SFT)#
For SFT, pass the metrics_logging_options to the TrainingConfig.
from tunix.sft import metrics_logger
from tunix.sft import peft_trainer

options = metrics_logger.MetricsLoggerOptions(
    log_dir="/tmp/logs",
    project_name="my-sft-project",
)

training_config = peft_trainer.TrainingConfig(
    eval_every_n_steps=100,
    metrics_logging_options=options,
    # ... other configurations
)

trainer = peft_trainer.PeftTrainer(
    model=model,
    optimizer=optimizer,
    training_config=training_config,
)
Reinforcement Learning (RL)#
For RL, pass the metrics_logging_options to the RLTrainingConfig, which is
then used in ClusterConfig.
from tunix.rl import rl_cluster
from tunix.sft import metrics_logger

options = metrics_logger.MetricsLoggerOptions(
    log_dir="/tmp/logs",
    project_name="my-rl-project",
)

training_config = rl_cluster.RLTrainingConfig(
    actor_optimizer=optimizer,
    metrics_logging_options=options,
    # ... other configurations
)

cluster_config = rl_cluster.ClusterConfig(
    role_to_mesh=role_to_mesh,
    training_config=training_config,
    rollout_config=rollout_config,
    # ... other configurations
)

cluster = rl_cluster.RLCluster(
    actor=actor_model,
    tokenizer=tokenizer,
    cluster_config=cluster_config,
)
Logging Backends Supported#
Tunix supports several logging backends out of the box, powered by metrax
link. The default backend selection
depends on the execution environment.
Wandb#
Weights & Biases is a supported backend for experiment tracking. (Backend Code)
Availability: Enabled by default in external environments (if
wandbis installed).Configuration:
project_name: Sets the Wandb project name (default: “tunix”).run_name: Sets the specific run name. If not provided, it defaults to a timestamp (e.g.,2025-01-14_08-40-01). Note: Wandb distinguishes between a run name and a run id. Runs with the same name are tracked as separate entities differentiated by their run id.
TensorBoard#
TensorBoard is supported for visualizing metrics. (Backend Code)
Availability: Enabled by default in external environments.
Configuration:
log_dir: Directory where event files are written.flush_every_n_steps: Frequency of flushing logs to disk (default: 100).
Custom metric logger#
You can integrate any logging service by creating a custom backend that conforms
to the metrax.logging.LoggingBackend protocol.
1. The Protocol#
Your custom backend class only needs to implement log_scalar and close.
Explicit inheritance from a base class is not required since Metrax uses
Python’s structural typing (duck typing).
from typing import Protocol
import numpy as np

class LoggingBackend(Protocol):
  def log_scalar(self, event: str, value: float | np.ndarray, **kwargs):
    """Logs a scalar value.

    Args:
      event: The name of the metric/event (e.g., "train/loss").
      value: The scalar value of the metric.
      **kwargs: Additional arguments, typically including 'step' (int).
    """
    ...

  def close(self):
    """Closes the logger and flushes any pending data."""
    ...
2. Creating a Custom Backend#
Here is an example of a backend that simply prints metrics to stdout:
class SimplePrintBackend:
    def log_scalar(self, event, value, **kwargs):
        print(f"Logged {event}: {value}")

    def close(self):
        print("Closing backend.")
3. Using Your Custom Backend#
To use your custom backend, you must pass a factory (a callable that returns
an instance) to MetricsLoggerOptions. This ensures configuration objects
remain serializable and safe to copy.
Case A: Simple Backend (No Arguments)#
If your backend class requires no arguments in its __init__, you can simply
pass the class itself.
options = metrics_logger.MetricsLoggerOptions(
    log_dir="/tmp/logs",
    backend_factories=[SimplePrintBackend],
)

logger = metrics_logger.MetricsLogger(metrics_logger_options=options)
Case B: Backend with Arguments#
If your backend requires arguments, use a lambda to create a factory.
class FileBackend:
    def __init__(self, filename):
        self.file = open(filename, 'w')

    def log_scalar(self, event, value, **kwargs):
        self.file.write(f"{event},{value}\n")

    def close(self):
        self.file.close()

# Create a factory using a lambda
my_file_factory = lambda: FileBackend(filename="/tmp/metrics.csv")

options = metrics_logger.MetricsLoggerOptions(
    log_dir="/tmp/logs",
    backend_factories=[my_file_factory]
)

logger = metrics_logger.MetricsLogger(metrics_logger_options=options)
Performance Metric Tracing#
Tunix provides a highly lightweight performance tracing and metrics collection system designed specifically for RL workflows. Unlike detailed profiling tools (e.g., xprof or standard JAX profiling), which collect exhaustive low-level details but incur significant overhead and are typically only used for short debugging intervals (e.g., 10s of seconds), this tracing system is designed with minimal overhead. It can safely be left enabled for the entire duration of your training run. It allows you to monitor the execution time of different stages (e.g., rollout, actor training, reference inference) across both host and device timelines.
Note: Performance metric tracing is currently only supported for the GRPO main entry point.
There are currently two versions of the performance metrics system:
Original Version (v1) (Code): Uses
PerfSpanQueryto extract spans and compute metrics (e.g., rollout time, wait time).Experimental Version (v2) (Code): A more flexible version that tracks
Timelineobjects and is planned to replace v1.
Both versions can export metrics to your custom export function and write detailed Perfetto trace files that can be visualized at ui.perfetto.dev.
Using Performance Metrics via CLI#
When running Tunix via the CLI, you can configure performance metrics by
providing a perf_metrics_options dictionary inside your rl_training_config.
rl_training_config:
  perf_metrics_options:
    enable_perf_v1: true         # Enable v1 (default: true)
    enable_perf_v2: false        # Enable v2 (default: false)
    enable_trace_writer: true    # Enable writing Perfetto trace files (default: true)
    trace_dir: "/tmp/perf_trace" # Directory to write the trace files to
    custom_export_fn_path: "path.to.my.custom_fn"       # Optional path to a custom v1 export function
    custom_export_fn_path_v2: "path.to.my.custom_fn_v2" # Optional path to a custom v2 export function
The CLI automatically parses these options, initializes the appropriate export functions, and registers them with the training cluster.
Note that enable_perf_v1 and enable_perf_v2 can be toggled independently,
allowing you to use one or both systems simultaneously. If you wish to use a
custom export function instead of the defaults, you must provide the fully
qualified import path to your function via custom_export_fn_path (for v1) and
custom_export_fn_path_v2 (for v2).
Using Performance Metrics via Code#
If you are initializing the RLCluster programmatically, you must construct a
PerfMetricsConfig and pass it to the cluster manually.
Original Version (v1)#
In v1, use PerfMetricsExport.from_cluster_config() to generate a default
export function. This function automatically computes various duration metrics
based on the cluster’s mesh topology (e.g., whether the rollout and actor models
are collocated or on different TPU meshes
code.
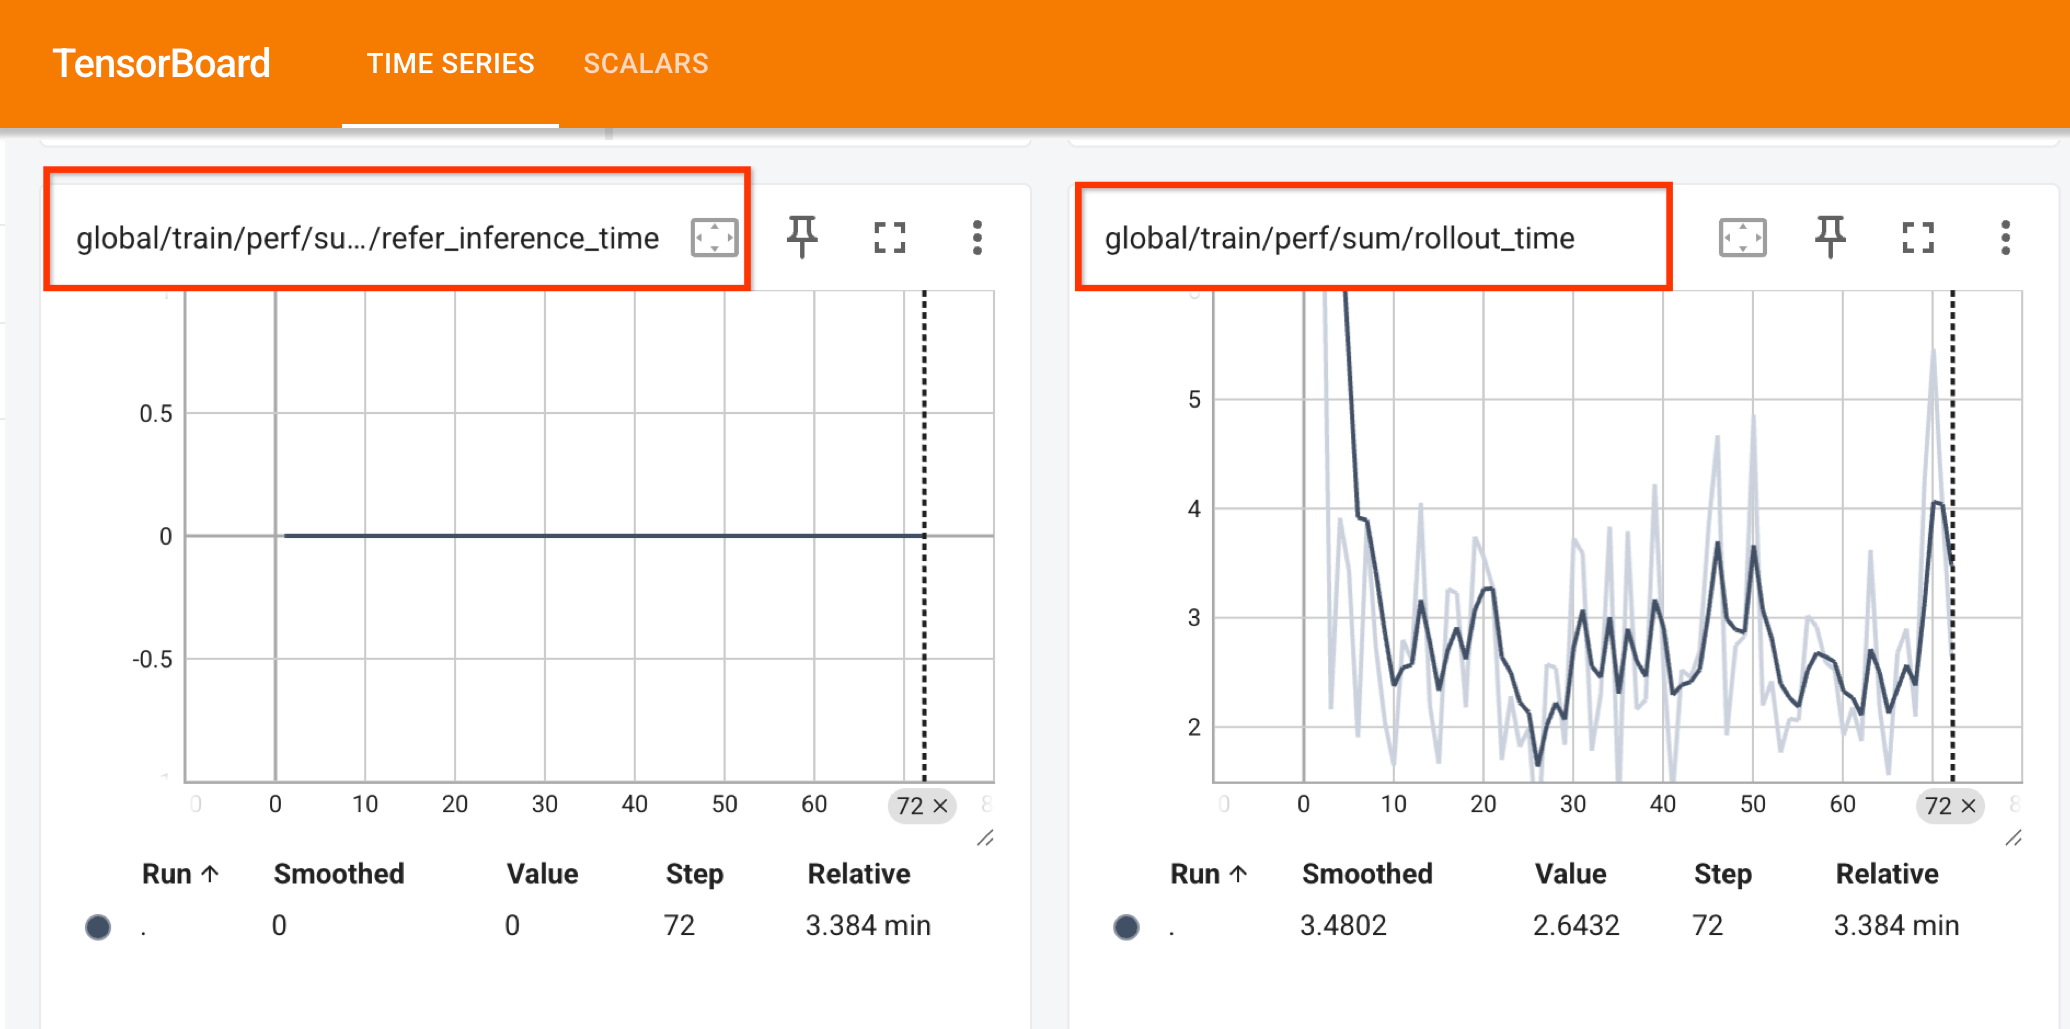
The metrics are aggregated per global_step and use the
Metric Logger to log to the desired output. For example,
if TensorBoard is activated:
By default, v1 also writes detailed execution traces to Perfetto Proto formatted
file. It reads perf_metrics_options from the cluster configuration to
initialize the trace writer. You can specify the output directory by configuring
trace_dir within PerfMetricsOptions inside your RLTrainingConfig.
from tunix.perf import metrics as perf_metrics
from tunix.perf import export as perf_export
from tunix.rl import rl_cluster
from tunix.sft import metrics_logger


# 1. Define metric logger options (for collecting aggregate perf metrics).
metric_logger_options = metrics_logger.MetricsLoggerOptions(
    log_dir="/tmp/tensorboard/grpo",
    project_name="my-rl-project",
)

training_config = rl_cluster.RLTrainingConfig(
    metrics_logging_options=metric_logger_options,
    # ... other configurations
)

cluster_config = rl_cluster.ClusterConfig(
    training_config=training_config,
    # ... other configurations
)

# 2. Create a PerfMetricsConfig object.
perf_config = perf_metrics.PerfMetricsConfig()
perf_config.custom_export_fn = (
    perf_export.PerfMetricsExport.from_cluster_config(cluster_config)
)


# 3. Pass the config to the RLCluster.
cluster = rl_cluster.RLCluster(
    actor=actor_model,
    tokenizer=tokenizer,
    cluster_config=cluster_config,
    perf_config=perf_config,
)
Experimental Version (v2)#
For the experimental version, you can use the default export function, which
writes the raw timelines to a Perfetto trace file by using the
PerfMetricExport class. The trace files can be written to a directory
by defining trace_dir. If trace_dir is not provided, it defaults to
/tmp/perf_traces. The v2 version supports local files and remote endpoints
supported by etils.epath including GCS such as gs://your-bucket/path/.
Note that v2 is still experimental and additional capabilities, such as exporting aggregated metrics to TensorBoard, are WIP. Once the functionality is complete, v2 will be replacing the original version.
from tunix import PerfMetricsConfig
from tunix.perf.experimental.export import PerfMetricsExport
from tunix.rl import rl_cluster


# 1. Define cluster_config (as you would for your RL job)
cluster_config = rl_cluster.ClusterConfig(
    training_config=training_config,
    # ... other configurations
)

# 2. Create a PerfMetricsConfig with custom_export_fn_v2 defined.
perf_metrics_config = PerfMetricsConfig(
    custom_export_fn_v2=PerfMetricsExport.from_cluster_config(
        cluster_config=cluster_config,
        trace_dir="/tmp/agentic_perf",
    ).export_metrics
)

# 3. Pass the config to the RLCluster.
cluster = rl_cluster.RLCluster(
    actor=actor_model,
    tokenizer=tokenizer,
    cluster_config=cluster_config,
    perf_config=perf_config,
)
Custom Export Functions#
If you want to compute custom metrics from the collected spans instead of using the defaults, you can define and provide your own export function.
Custom Export Function for v1:
A v1 export function takes a PerfSpanQuery and returns a dictionary of
metrics.
from tunix.perf import metrics as perf_metrics

def my_custom_export_fn(query: perf_metrics.PerfSpanQuery) -> perf_metrics.MetricsT:
    # Example: query main thread for the latest 'global_step' group
    global_steps = query().main().last_group("global_step").get()
    if global_steps:
        # MetricsT maps metric names to (value, optional_aggregation_fn)
        return {"perf/custom_step_time": (global_steps[0].duration, None)}
    return {}

perf_config.custom_export_fn = my_custom_export_fn
Custom Export Function for v2:
A v2 export function takes a mapping of timeline IDs to their respective
Timeline objects.
from tunix.perf import metrics as perf_metrics
from tunix.perf.experimental import tracer

def my_custom_export_fn_v2(timelines: dict[str, tracer.Timeline]) -> perf_metrics.MetricsT:
    # Example: iterate over host and device timelines
    for tl_id, timeline in timelines.items():
        pass # Analyze timeline.root span
    return {}

perf_config.custom_export_fn_v2 = my_custom_export_fn_v2
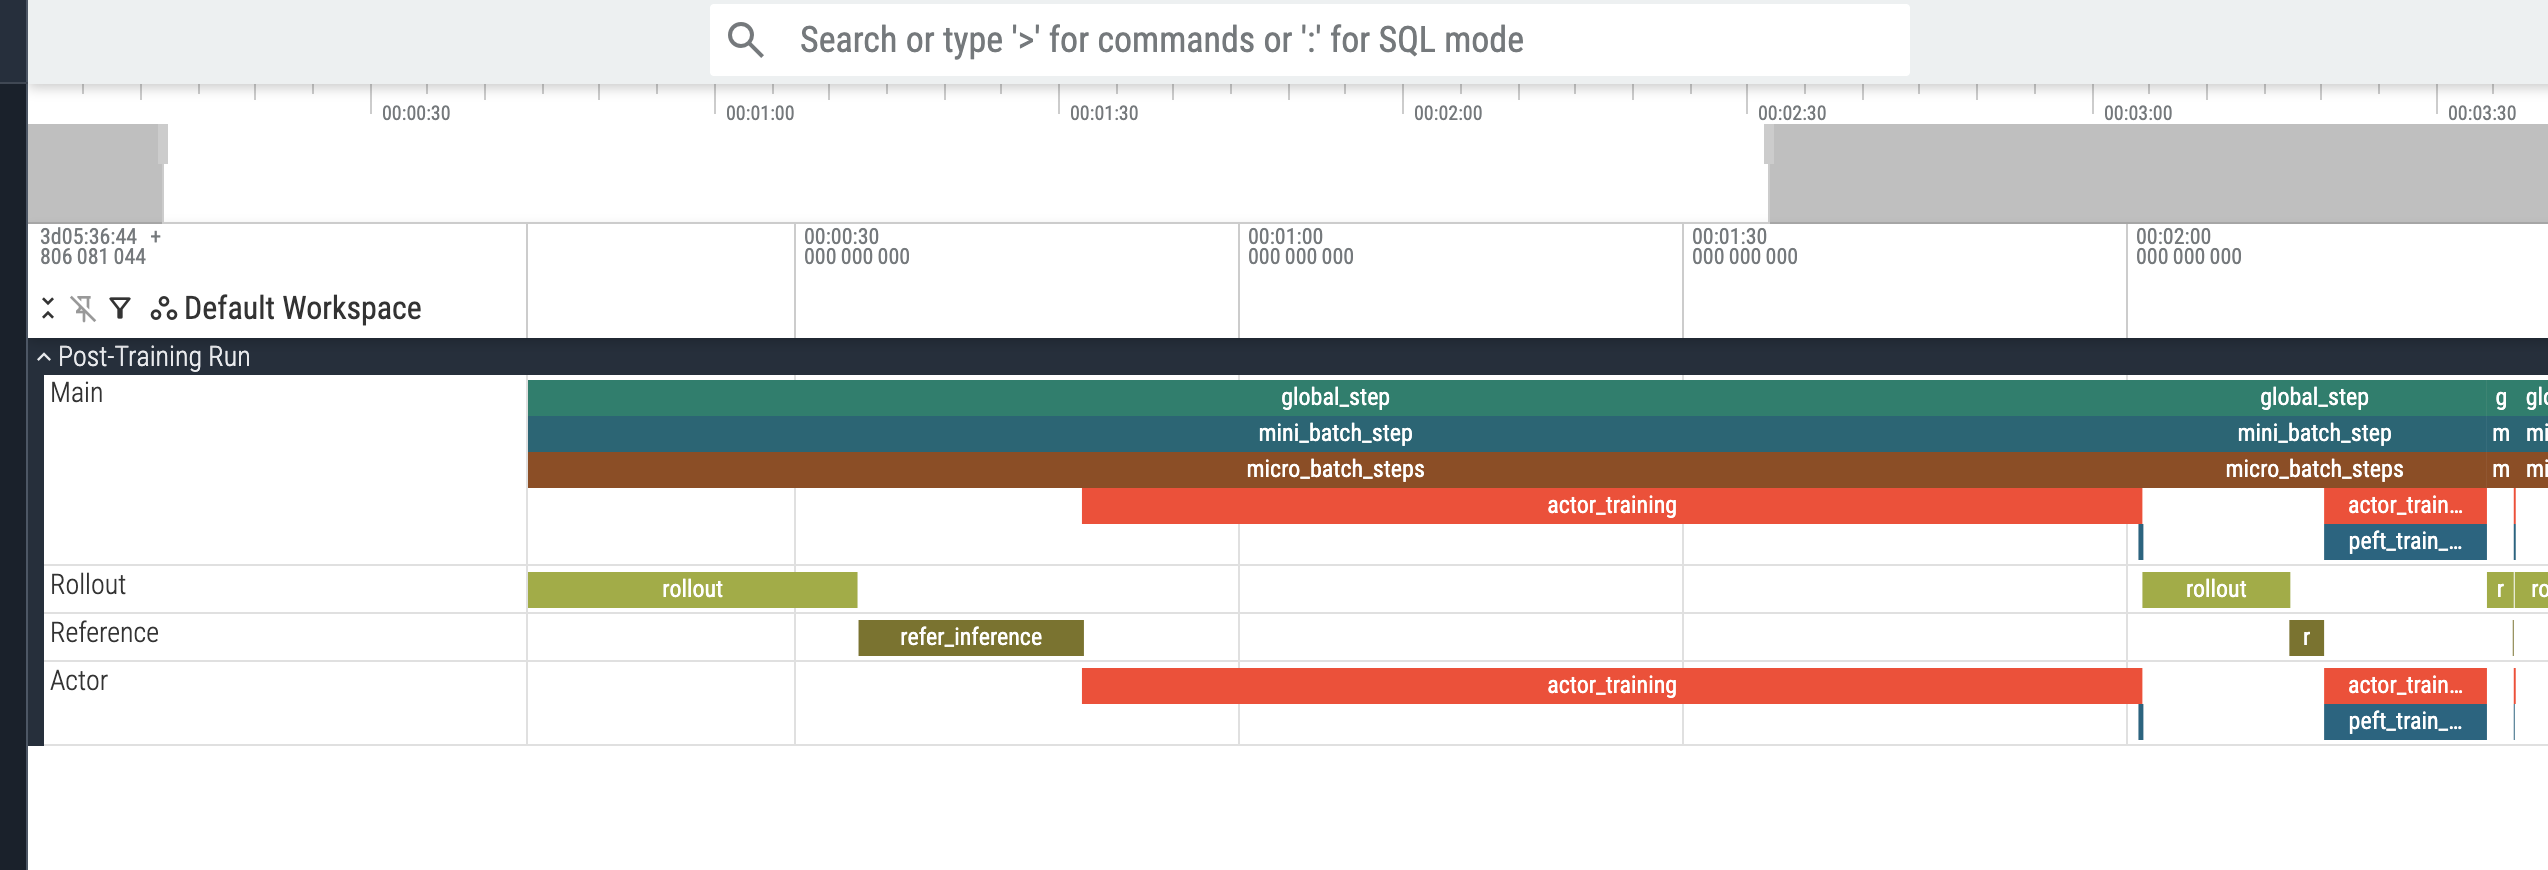
Visualizing with Perfetto#
If you have enabled the trace writer (by setting enable_trace_writer: true via
the CLI or by specifying trace_dir in your configuration), a proto-formatted
file (e.g., perfetto_trace_1771973518.pb) containing the raw spans and
timelines will be saved to the specified directory (which defaults to
/tmp/perf_traces). To view the trace, download the file to your local
machine and drag-and-drop it into the
Perfetto UI. The interface allows you to
interactively zoom, pan, and query the execution trace, as shown below: